Product has been added to the basket

Journey into the Earth


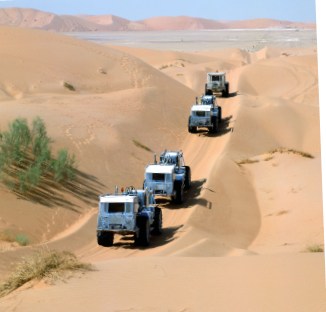
Seismic train in the desert

Paul R Wood* looks at how explorationists today use cutting edge technology to visualise the subsurface in 3D.


Geoscientist 17.9 September 2007


The goals of geologists and geophysicists engaged in the exploration and extraction of oil and gas resources are similar to those of many geoscientists. They need to develop models of the Earth, ranging from the scale of geological basins that may be thousands of square kilometres in size, to detailed and accurate descriptions of individual hydrocarbon reservoirs, often on a sub-metre scale.

Traditional geological mapping relies on regular sampling of surface outcrops, analysis of the clues presented by them of the structure and evolution of the strata, and interpolation of the data to provide three-dimensional maps and Earth models. This is also the task of geoscientists in energy companies, but the interpolation can take them to thousands of metres depth, or far offshore , hundreds of kilometres from any outcrop.

Applying traditional geology is, of course, part of this task, and rock samples and data from great depths or where there are no outcrops can be taken from boreholes, many of them drilled as exploration or development wells by the oil and gas industry. However, even these wells cannot give the detail of spatial sampling we require. For many years the most common method used in the industry to help build Earth models has been to conduct seismic reflection surveys. Acoustic impulses are generated at the surface by compressed air at sea, or special trucks (VibroseisTM) on land. The signals are reflected by subsurface strata and measured by surface detectors that convert them to electronic data and record them on magnetic tape. Computer processing of the data then reveals the subsurface structure and properties of the rocks such as their density and the speed of the acoustic waves transmitted through them. From these we can infer other characteristics such as porosity, pressure, and in some cases the type of fluid contained in the pore spaces.

3D seismic surveys

Before the 1970s, seismic surveys were acquired as a series of profiles – usually straight traverses across the surface that yielded two-dimensional cross-sections of the Earth (2D seismic). Such surveys are still conducted today over large areas in order to develop models at geological basin scale. The accuracy of the models depends on the spacing of the traverses – closer spacing incurring higher costs. Over the past 40 years, however, three-dimensional survey methods have been developed (3D seismic). On land we deploy the acoustic signal (source) and detector (receiver) profiles in orthogonal directions. At sea, specially equipped seismic vessels tow multiple sets of sources and receivers simultaneously. By covering a surface area with the survey, a three-dimensional image of the Earth beneath can be generated. This gives more detailed sampling than is possible with 2D, and additional computer processing can make the image more accurate.

3D Seismic cube The output of a 3D survey is still an image, shown on a computer display as a series of data traces or acoustic interfaces plotted with colours representing the amount of energy reflected by the interfaces. A geoscientist - seismic interpreter - still has to convert the data into a realistic geological model, merging the seismic with other information such as from gravity and magnetic surveys, borehole measurement and surface samples. Computer workstations are used for this, with software that follows the interfaces and makes maps. But the interpreters still have a problem – how is it possible to show the huge amount of data in a 3D survey – a three-dimensional view of the Earth – in three dimensions and not just as a series of profiles on a flat screen?

3D visualisation

The answer is 3D visualisation. The computer can create separate left- and right-eye views of the data and display them alternately, very fast. Interpreters wear glasses that switch the left and right lens from clear to opaque and that are synchronised with the display. The users then see a 3D view of the data, enabling them to appreciate structural details and spatial relationships much more readily than on a flat display. If the data are displayed on large screens in special work areas or virtual reality rooms, then teams of geoscientists, well and production engineers can reach a mutual understanding of the complexities of the subsurface much more quickly than was previously possible.

In the rest of this article we show some displays from 3D seismic surveys. These can be viewed in three-dimensions by using the anaglyph glasses enclosed with this issue of Geoscientist. Because of the colour filtering effect, some clarity is lost compared with a full virtual reality display, but we hope this will give readers some idea of how we can see, in 3D, to a depth of many kilometres, and far offshore.

Mediterranean seabed

The first acoustic boundary that we see on offshore seismic data is also the most prominent – the interface between the sea water and the sea bed. The sea floor image on a 3D survey is a detailed bathymetric chart – and can already give us clues about the geology beneath it. A spectacular view of the sea bed in the deep waters of the Eastern Mediterranean allows geologists to make deductions about the forces that shaped this area and to infer the patterns of subsurface faults. Well engineers can also get information about the nature of the sea floor they will have to drill through – vital to avoid potential hazards.

Limestone rivers

Most of the analysis of seismic data is done, not on the actual data, but on features or attributes extracted from the data. The surface shown in the diagram below is a computer map made by allowing the software to track automatically the seismic reflection from a Cretaceous interface (ca. 90 Ma). This layer is now buried many hundreds of metres below the deserts of the Sultanate of Oman. The resulting map, where the colours show present-day depth variations, reveals meandering channels that flowed across a sub-aerial limestone, exposed in a period of uplift in the Turonian. The 3D display shows details of the channel interactions that would be difficult to infer from a flat display. Before the advent of 3D surveys, such features could not be mapped, as they are too subtle to follow on the wide spacing of a grid of 2D seismic profiles. A seismic profile taken from the 3D data is also displayed as a transparent vertical cross-section.

Gulf of Mexico

A complete 3D picture of the subsurface near two producing oil fields in the Gulf of Mexico not only shows the sea bed at some 1,000m water depth, but features such as salt structures in green and a salt diapir that penetrates the sea bed (white). Thin lines show the paths of wells drilled to over 2000m below the sea bed to develop the fields, fanning out to penetrate various reservoirs. Shallow bodies in front of the well paths on the left hand side may provide hazards to drilling. Oil field reservoirs can be seen in colour (yellows and reds) at deeper levels. Most features are extracted from the actual data, though parts of two seismic profiles are shown in black and white near the base of the display.

Deep water structures

In a 3D seismic survey in deep water outboard of the Indus fan, a surface has been highlighted to show the structures formed since deposition. Geologists have identified the yellow features as submarine sand flows that formed at the time of deposition and may be good quality reservoirs today. Formation of the structures probably occurred before or contemporaneously with the sand flow deposition as the flows are avoiding structural highs. Examining the data in 3D shows that a structural high, often interpreted as a good hydrocarbon trap, may not be a good exploration well location. The targets should rather be the down-flank features with better reservoir potential that are encased in sealing shales.

At shallower levels of this 3D survey, the analysis shows spectacular canyon and mud flow features. One mud flow reaches the sea bed (partly shown in brown), forming a present-day sub-sea mud volcano. The canyon feature, meandering on the upper sea floor slopes, provides a recent depositional analogue for deeper strata. The flat black and white surface is a horizontal slice through the seismic data, and displays an attribute called semblance, highlighting geological discontinuities such as faults.

Indus Fan channels

3D Seismic cube from Niger Delta showing thrust fault and site of drilled well

Nigeria success

The fold and thrust belt province in the deep water environment offshore Nigeria is structurally complex. Compressional tectonics have masked subtle turbidite channel features that were sourced from the Niger Delta. Visualisation of the 3D seismic data enabled geologists to unravel the complexity and determine where sand-prone channels coincided with structural highs, giving the best chance to combine hydrocarbon trap and reservoir. The 3D plot shows the sea bed at the top (water depth is more than 2,000m) where the expression of a major thrust fault can be seen. At the base of the seismic data cube (approx. 5,000m below sea level), a surface has been interpreted showing the lower structure of the major fault, and a smaller one to the left. An intermediate surface shows the structure induced by this smaller fault with turbidite channels draped over it. An exploration well was drilled on the culmination, where structure and channels coincided, resulting in a significant hydrocarbon discovery.

Conclusion

The ability of energy company geoscientists to construct Earth models of the deep and remote subsurface has been enhanced significantly by the development of the 3D seismic method. Since the 1970s the method has evolved into a sophisticated branch of technology involving the collection and processing of huge amounts of data. Modern computer algorithms enable us to map geological interfaces at depths of many kilometres with an accuracy of only a few metres. To be able to make accurate predictions about exploration locations and to develop oil and gas fields following successful discoveries, the geologists, geophysicists and engineers must be able to see and understand the spatial relationships of large subsurface volumes. Virtual reality rooms can allow teams to do this by visualizing the 3D data in three dimensions.

New hardware is becoming available that allows 3D visualisation to be performed on a variety of display types such as 3D televisions and holographic systems. Future visualisation systems will allow users to get a 3D view without special glasses. Shell and other companies are investigating these and similar systems with the objective of making them more widely available, so our geoscientists can view their 3D data in 3D, all the time, any time.


Acknowledgements

I would like to acknowledge the following Shell partners and data owners of examples shown in this article: CGGVeritas; Dajo Oil; Kufpec; Ministry of Oil and Gas, Sultanate of Oman; Nigerian National Petroleum Corporation; Petroleum Development Oman; Petroleum Unit of Brunei; Premier Oil.

* Dr Paul Wood is at Global Exploration, Shell International Exploration & Production B.V., Rijswijk, The Netherlands.